1870 · Maps
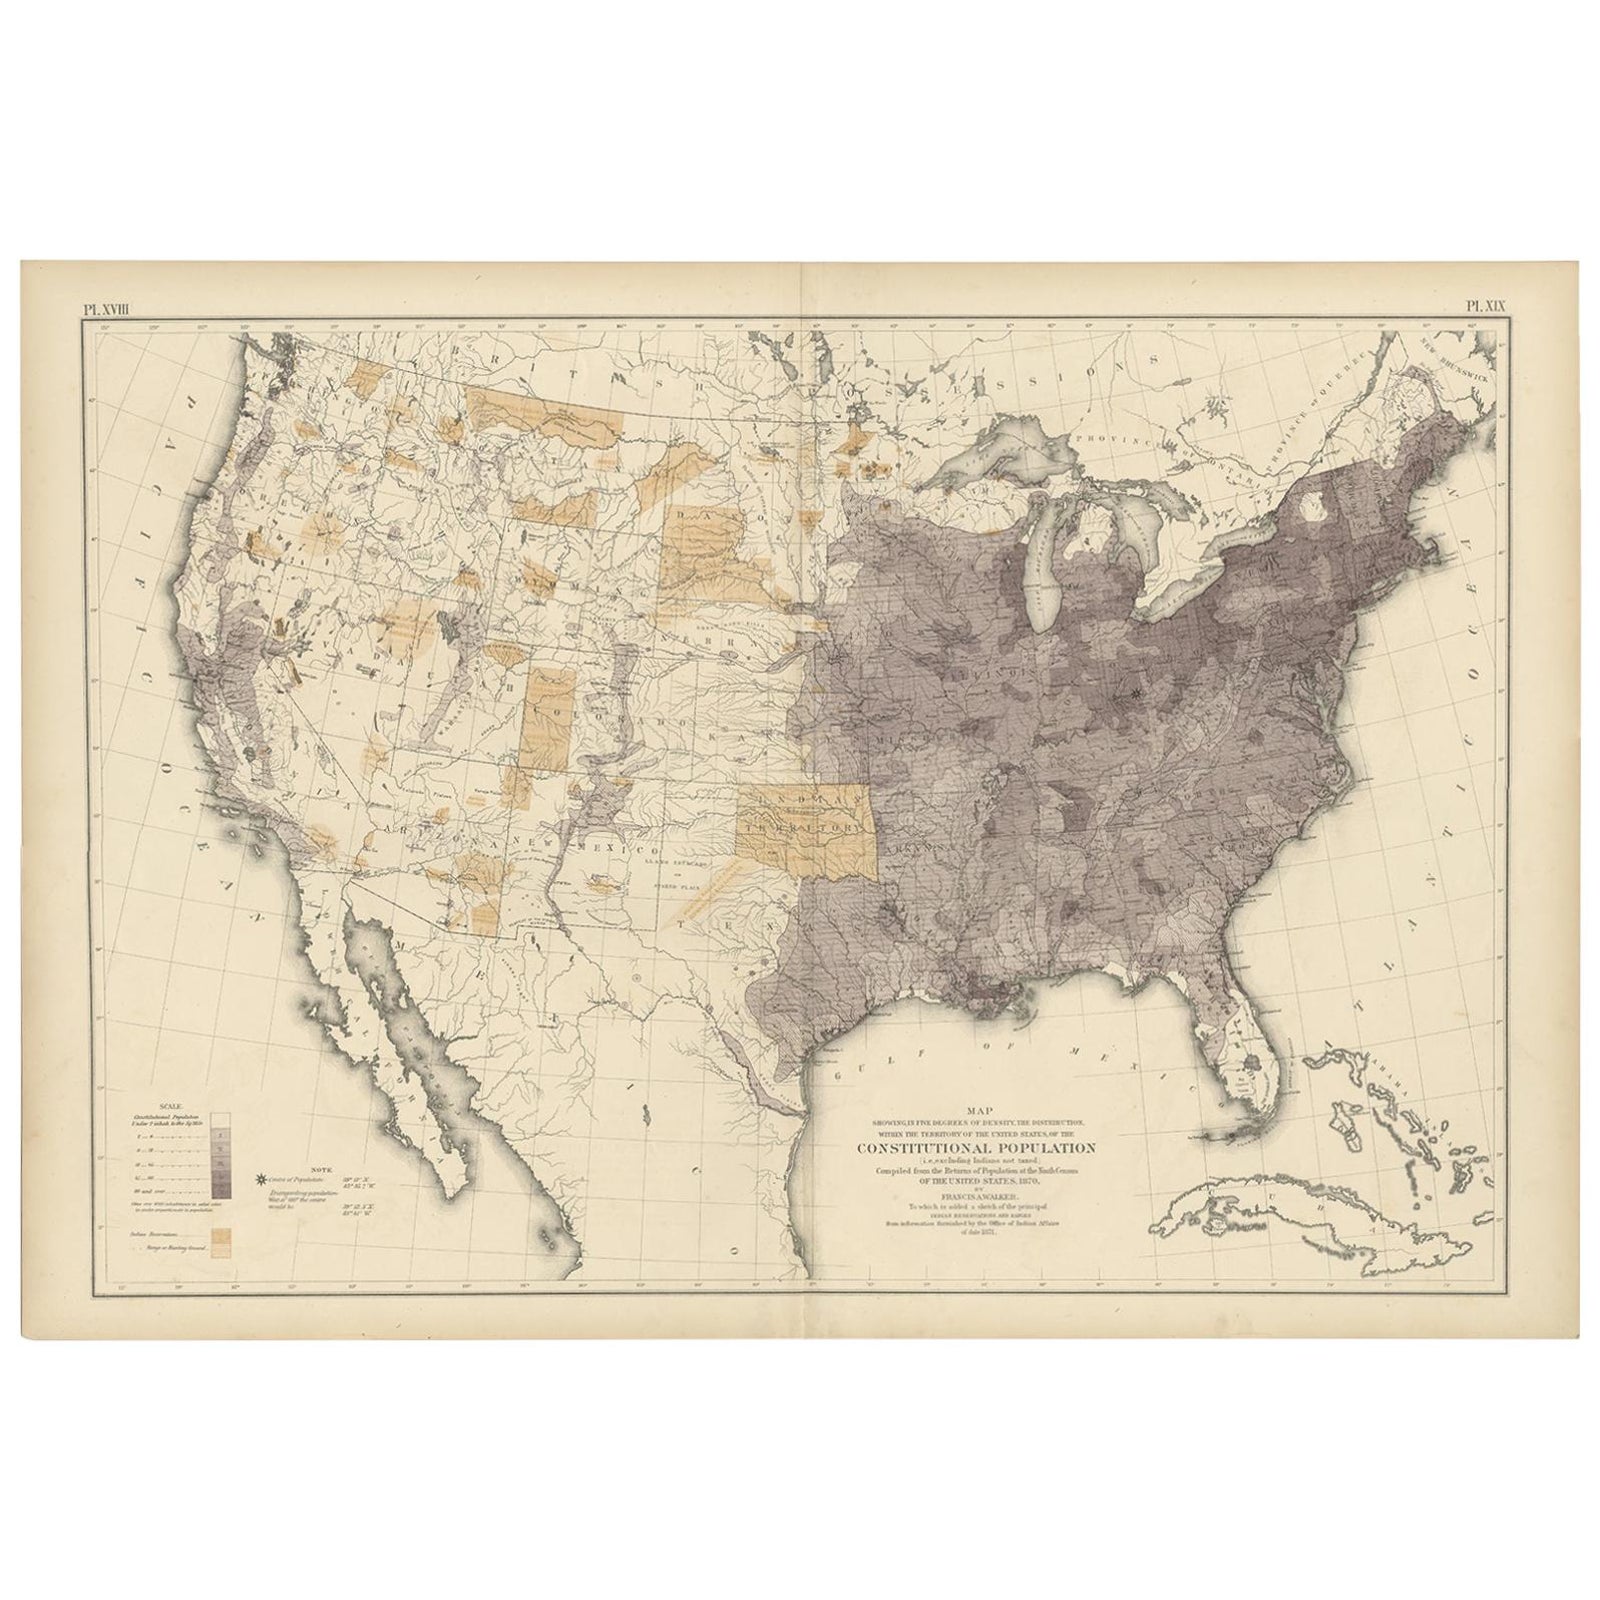
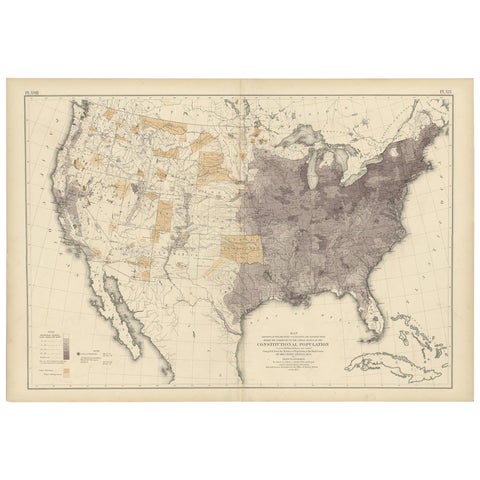
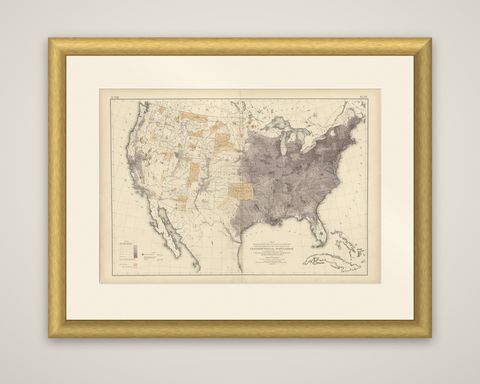
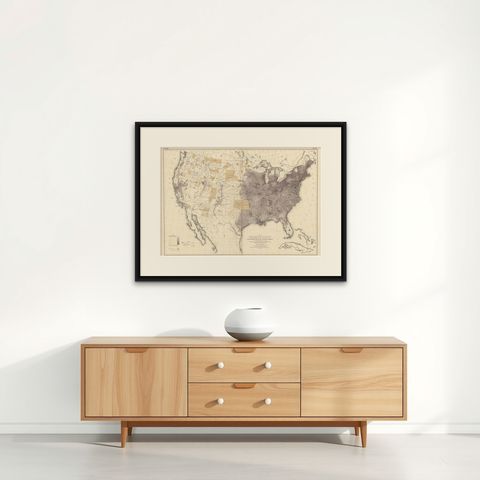
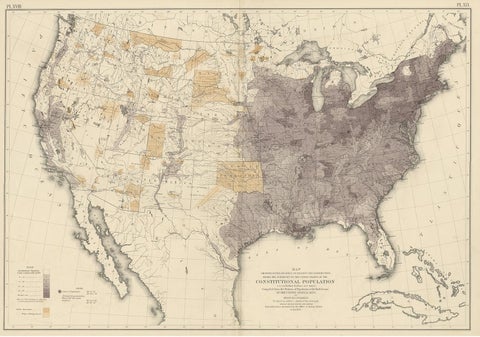
Antique Chart of the US Population in 1870, published in 1874
$1,005
€900 · dollar price at today's exchange rate
Buy now Ask a question
Shipping to the United States: $51 standard, $73 express, insured and tracked.
- Date
- 1870
- Kind
- Maps
- Size
- 55 × 79 cm (21.7 × 31.1 in)
- Condition
- Good. Original folding line. General age-related toning, minor wear. Blank verso, please study image carefully.
- Period
- The Gilded Age
- Reference
- BG-11875-37
What the condition grades mean
- Excellent
- Bright and clean, with no faults worth mentioning.
- Very good
- Only light signs of age, such as faint toning.
- Good
- Normal signs of age for a sheet of this period: toning, some foxing, small marks or neat old repairs.
- Fair
- Clear faults such as staining, tears or repairs, priced to match.
Every fault we see is written in the condition note, and the whole sheet is shown uncropped in the photos.
Guaranteed original. This is an original of the period stated, not a later reproduction or print-on-demand copy. If it is ever shown to be otherwise, we refund you in full.
Shipping to the United States. Sent from our gallery in Langweer, the Netherlands, flat between boards or rolled in a tube, and fully insured.
Delivery and import charges.
About this piece
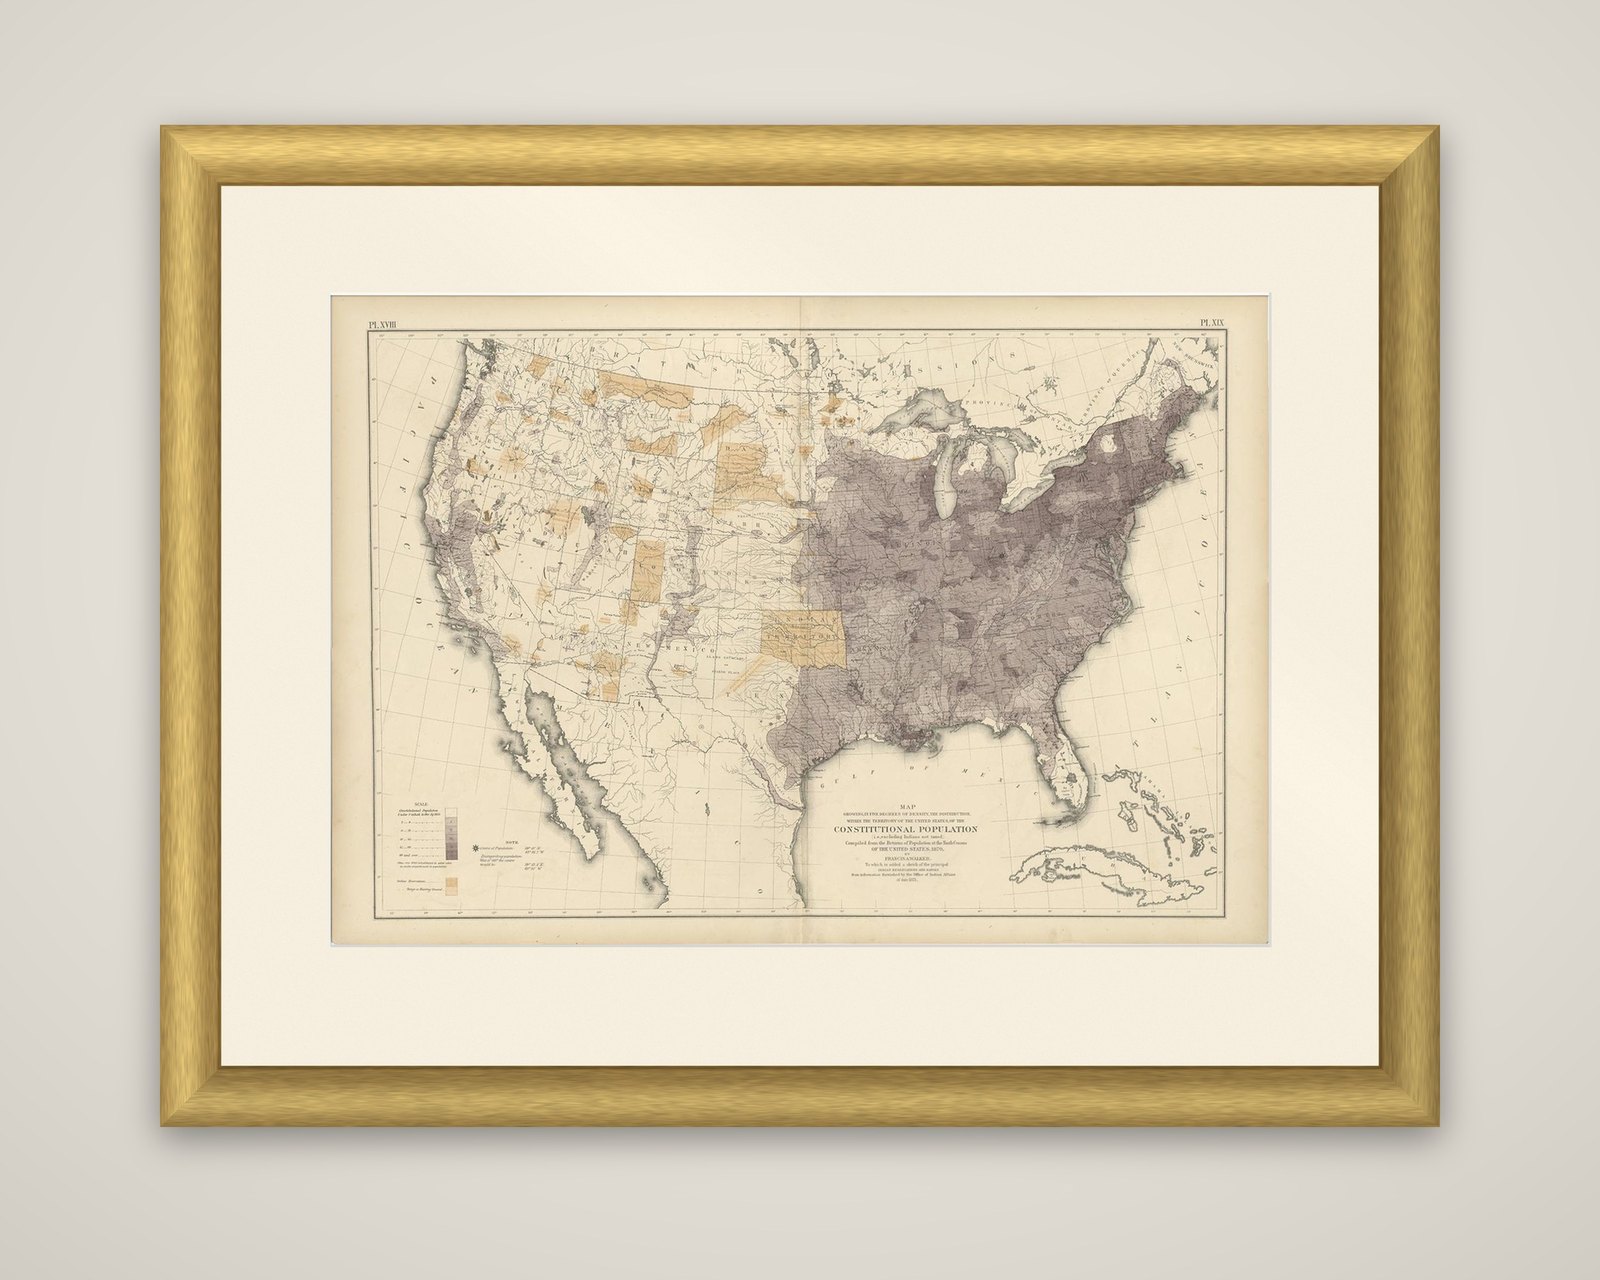
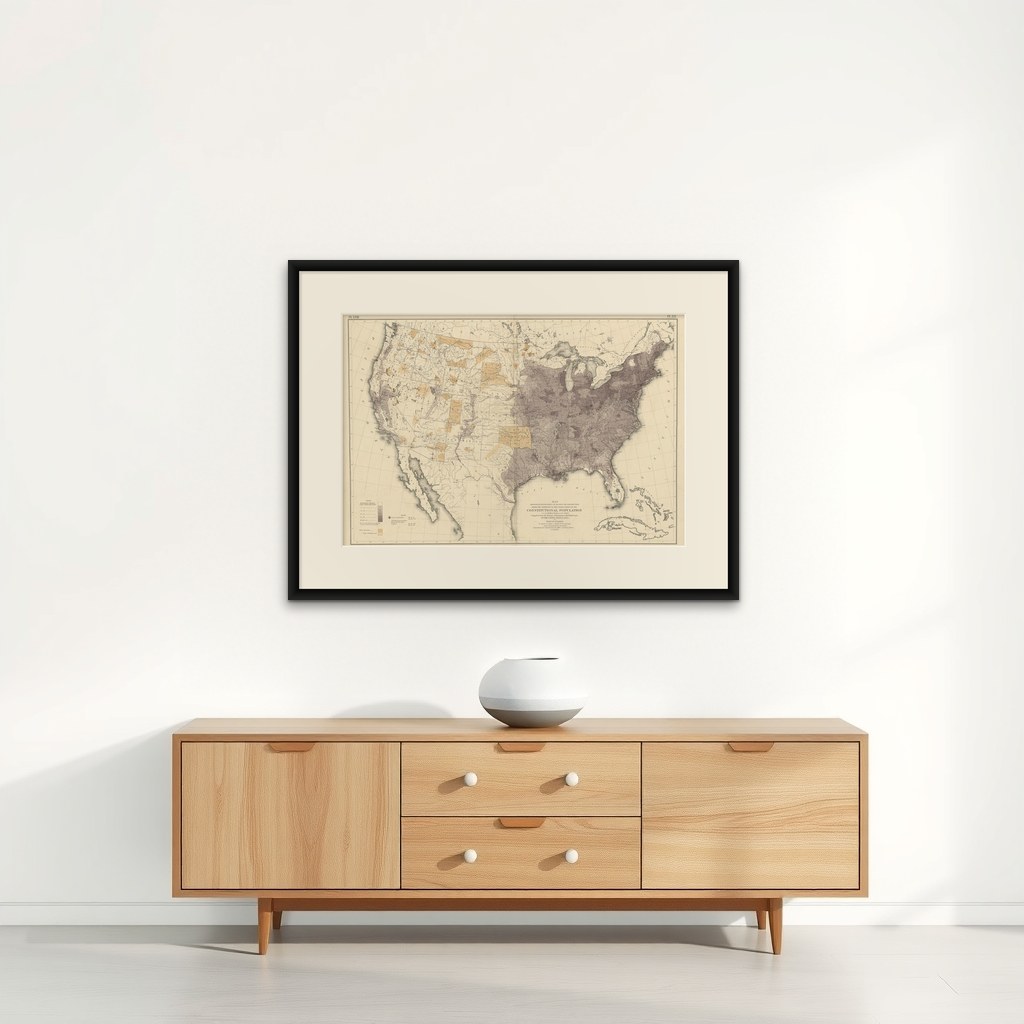
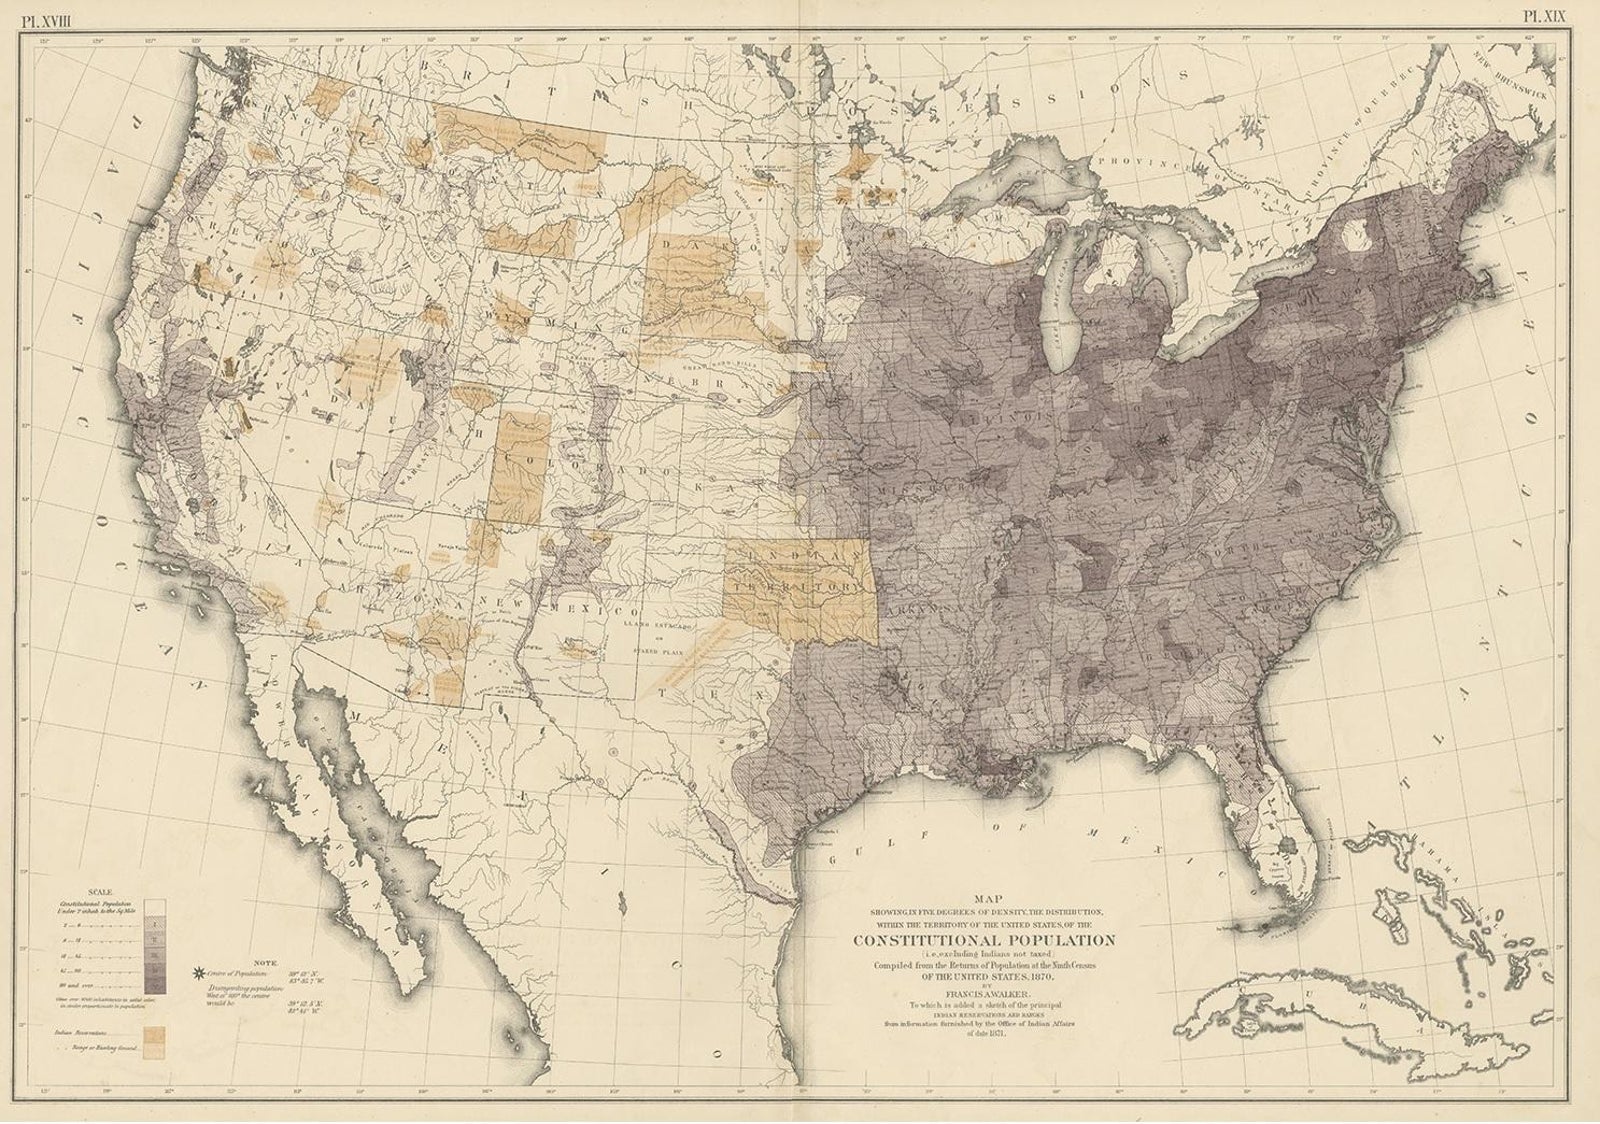
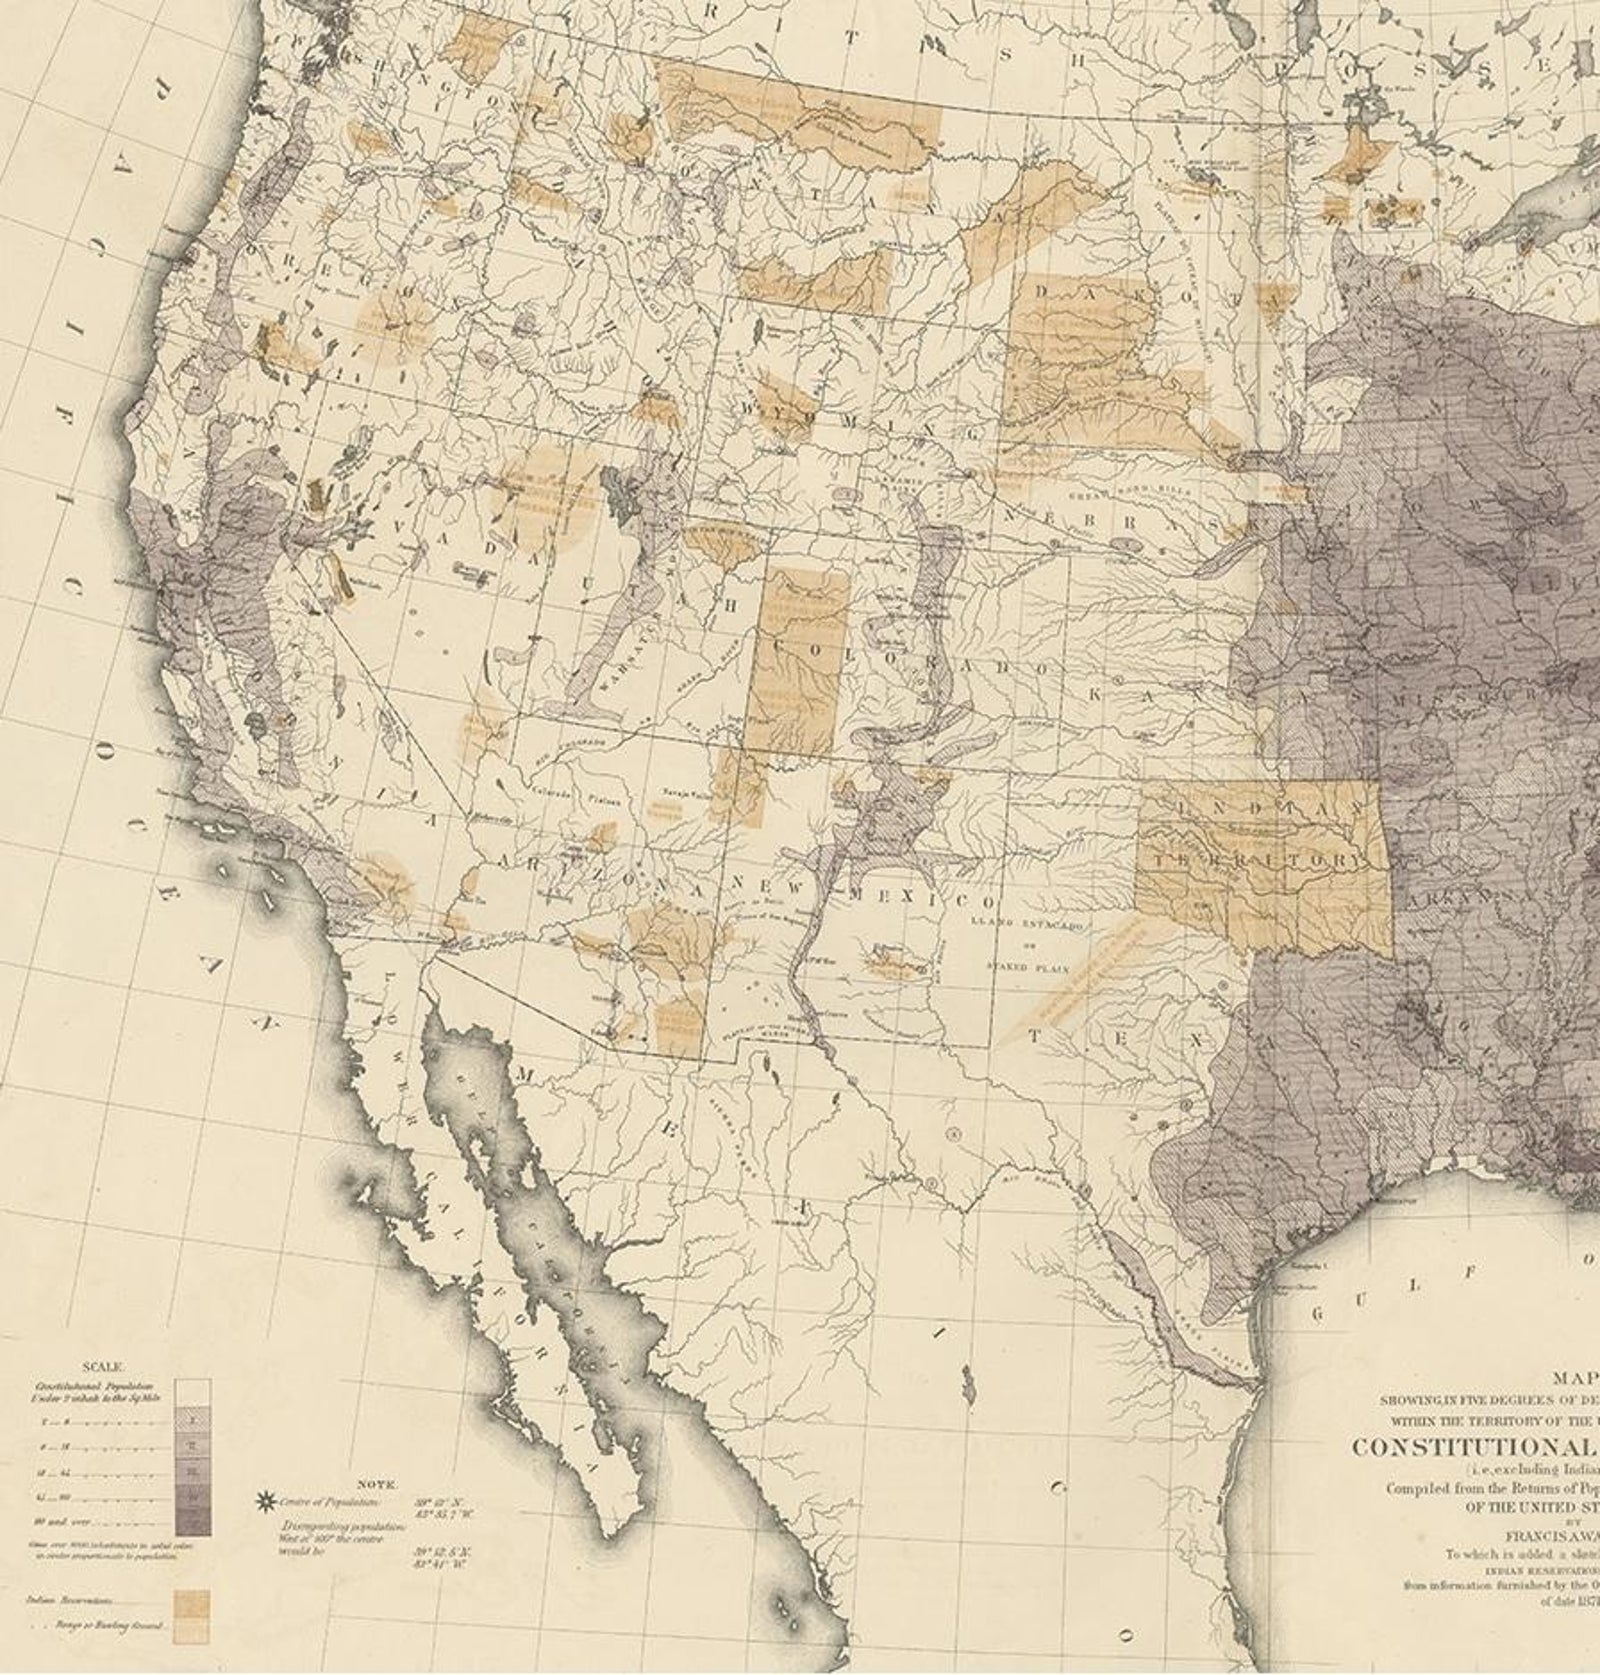
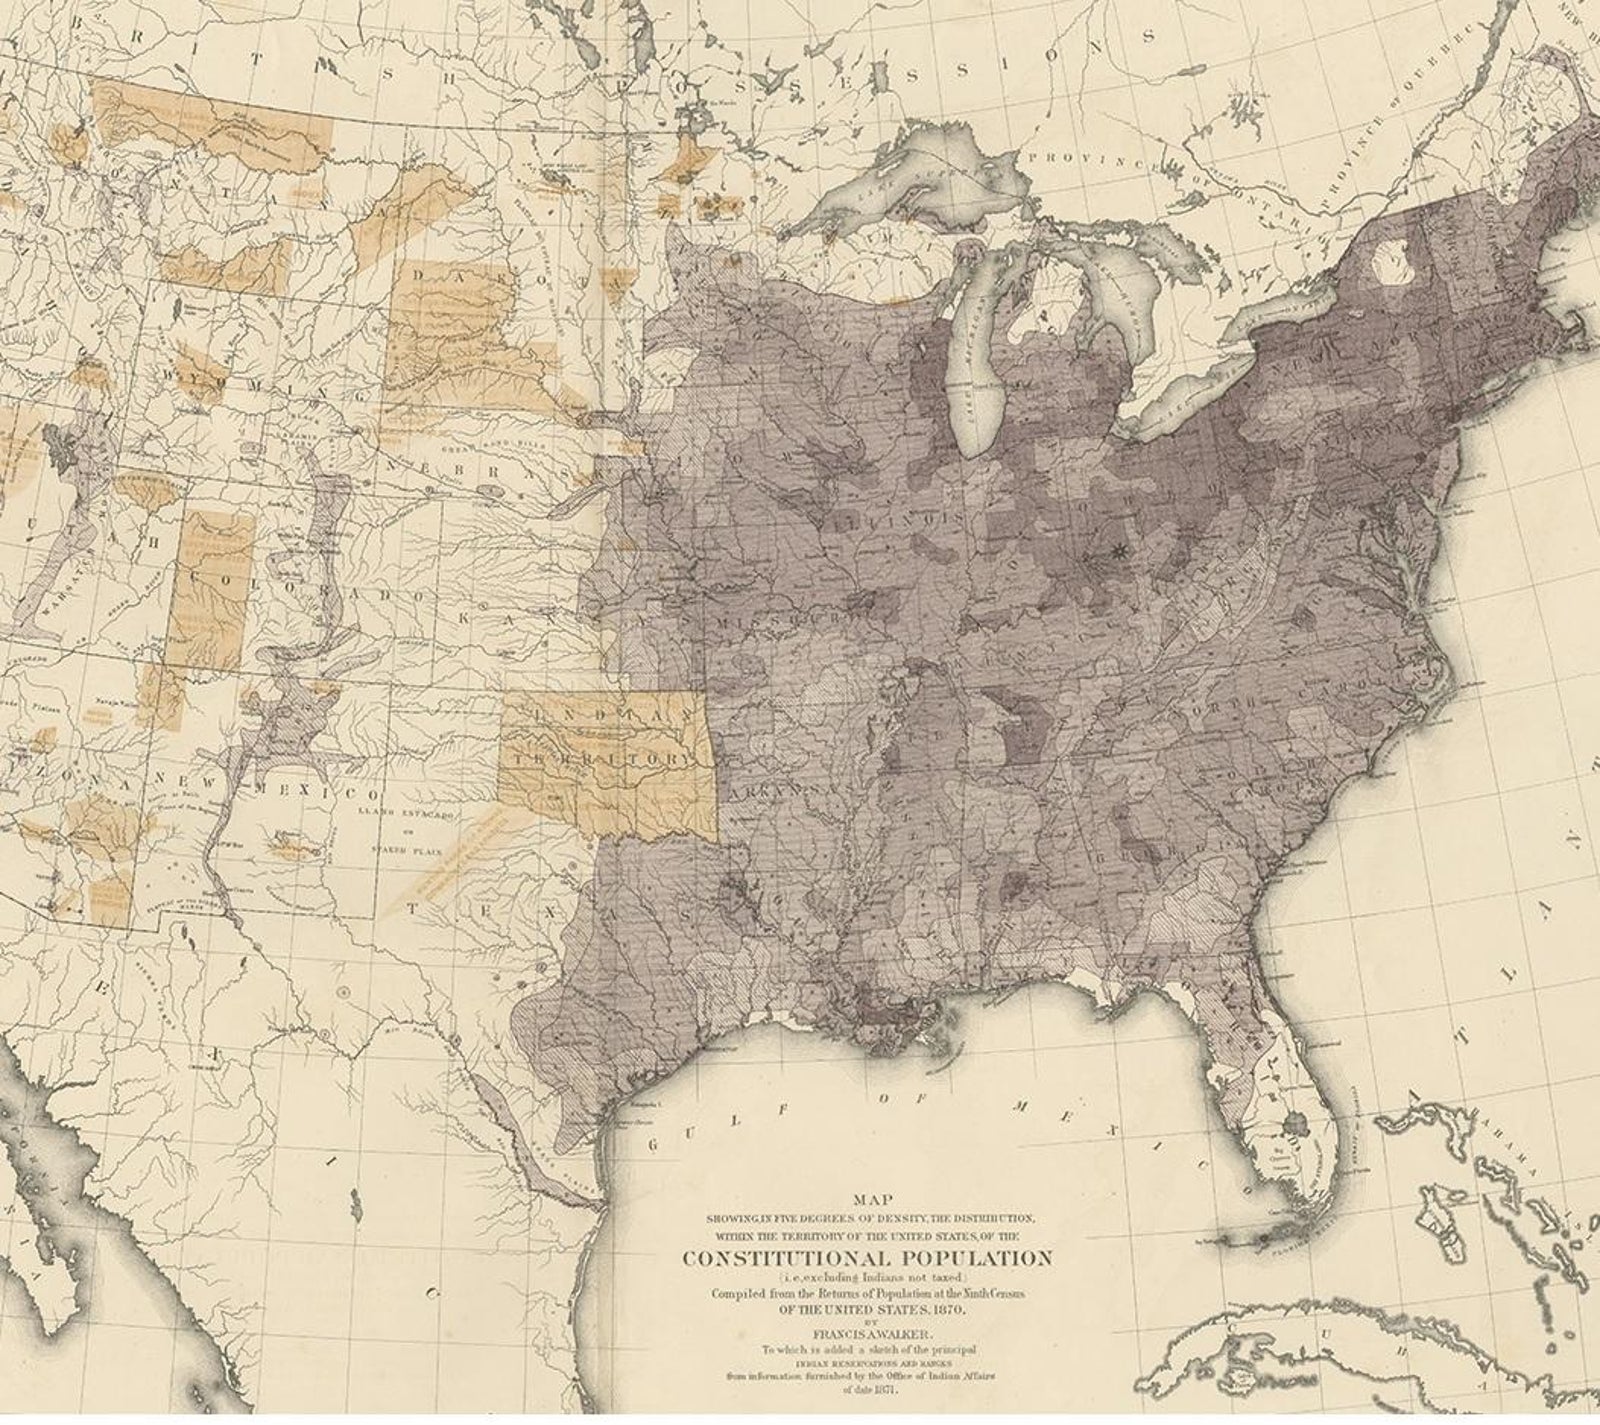
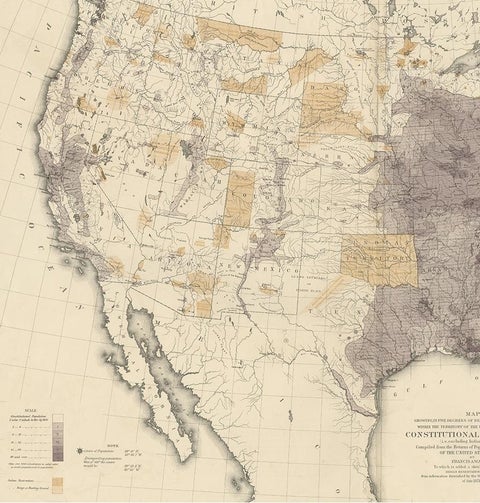
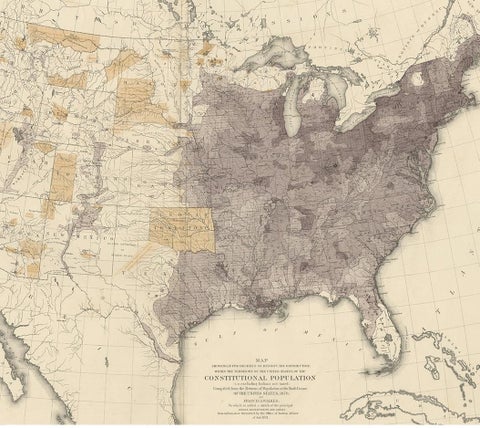
A population density map of the United States, compiled from the returns of the ninth census of 1870 by Francis A. Walker and published in 1874 in the Statistical Atlas of the United States based on the results of the ninth census. The sheet is a double-page color-printed map, numbered Pl. XVIII and XIX at the upper corners.
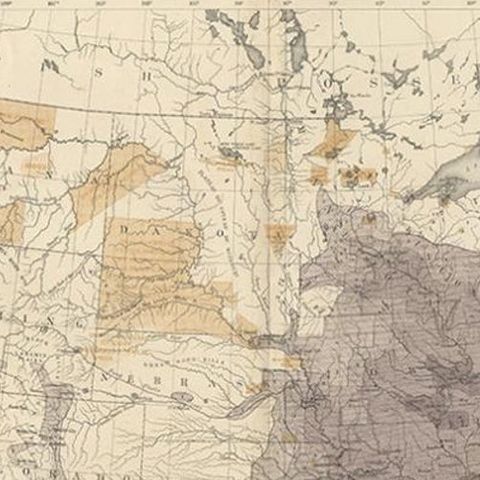
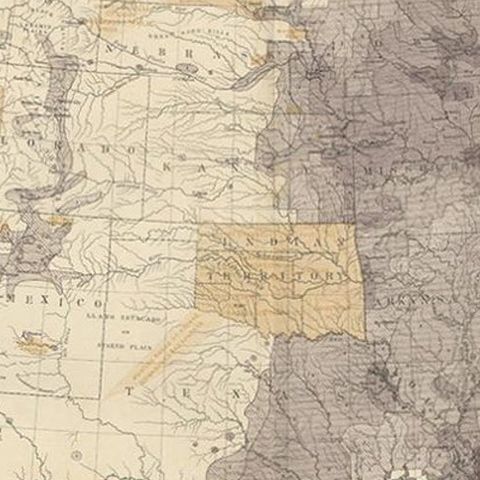
The full title reads "Map showing, in five degrees of density, the distribution, within the territory of the United States, of the constitutional population, i.e., excluding Indians not taxed." Density is rendered in graded tones of gray-violet that darken toward the Northeast, the Ohio Valley and the Gulf and Atlantic coasts, then thin out to bare paper across the Great Plains and the Mountain West. A legend at lower left explains the five degrees. Tan patches mark the principal Indian reservations and ranges, added as a sketch from information supplied by the Office of Indian Affairs in 1871, with the Indian Territory standing out clearly. Cuba and the Bahamas appear at the lower right, and the Pacific coast, Baja California and the Gulf of Mexico frame the sheet.
Walker directed the 1870 census, and the atlas drawn from it was among the first large statistical atlases of the country, setting population, wealth and climate on maps.