

1874 · Maps
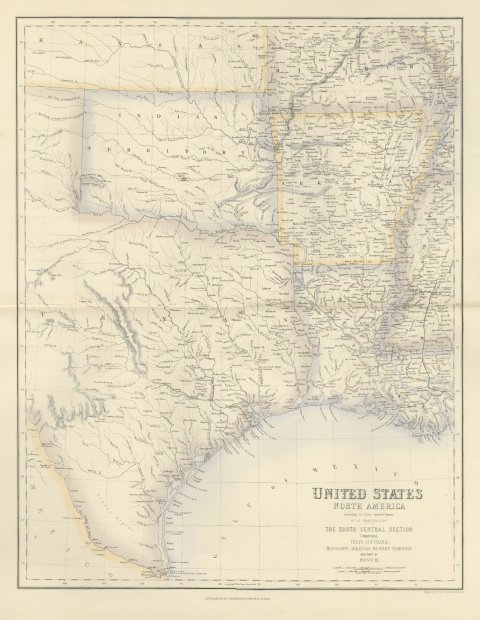
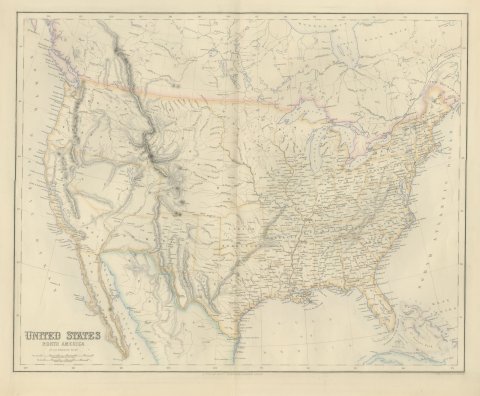
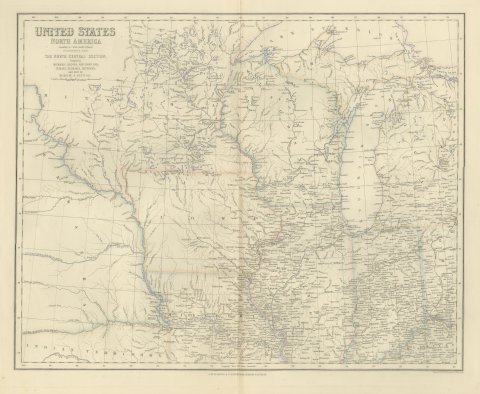
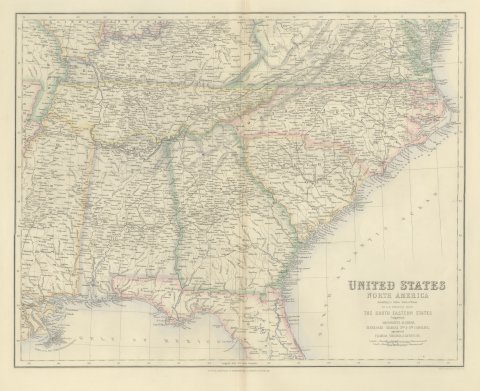
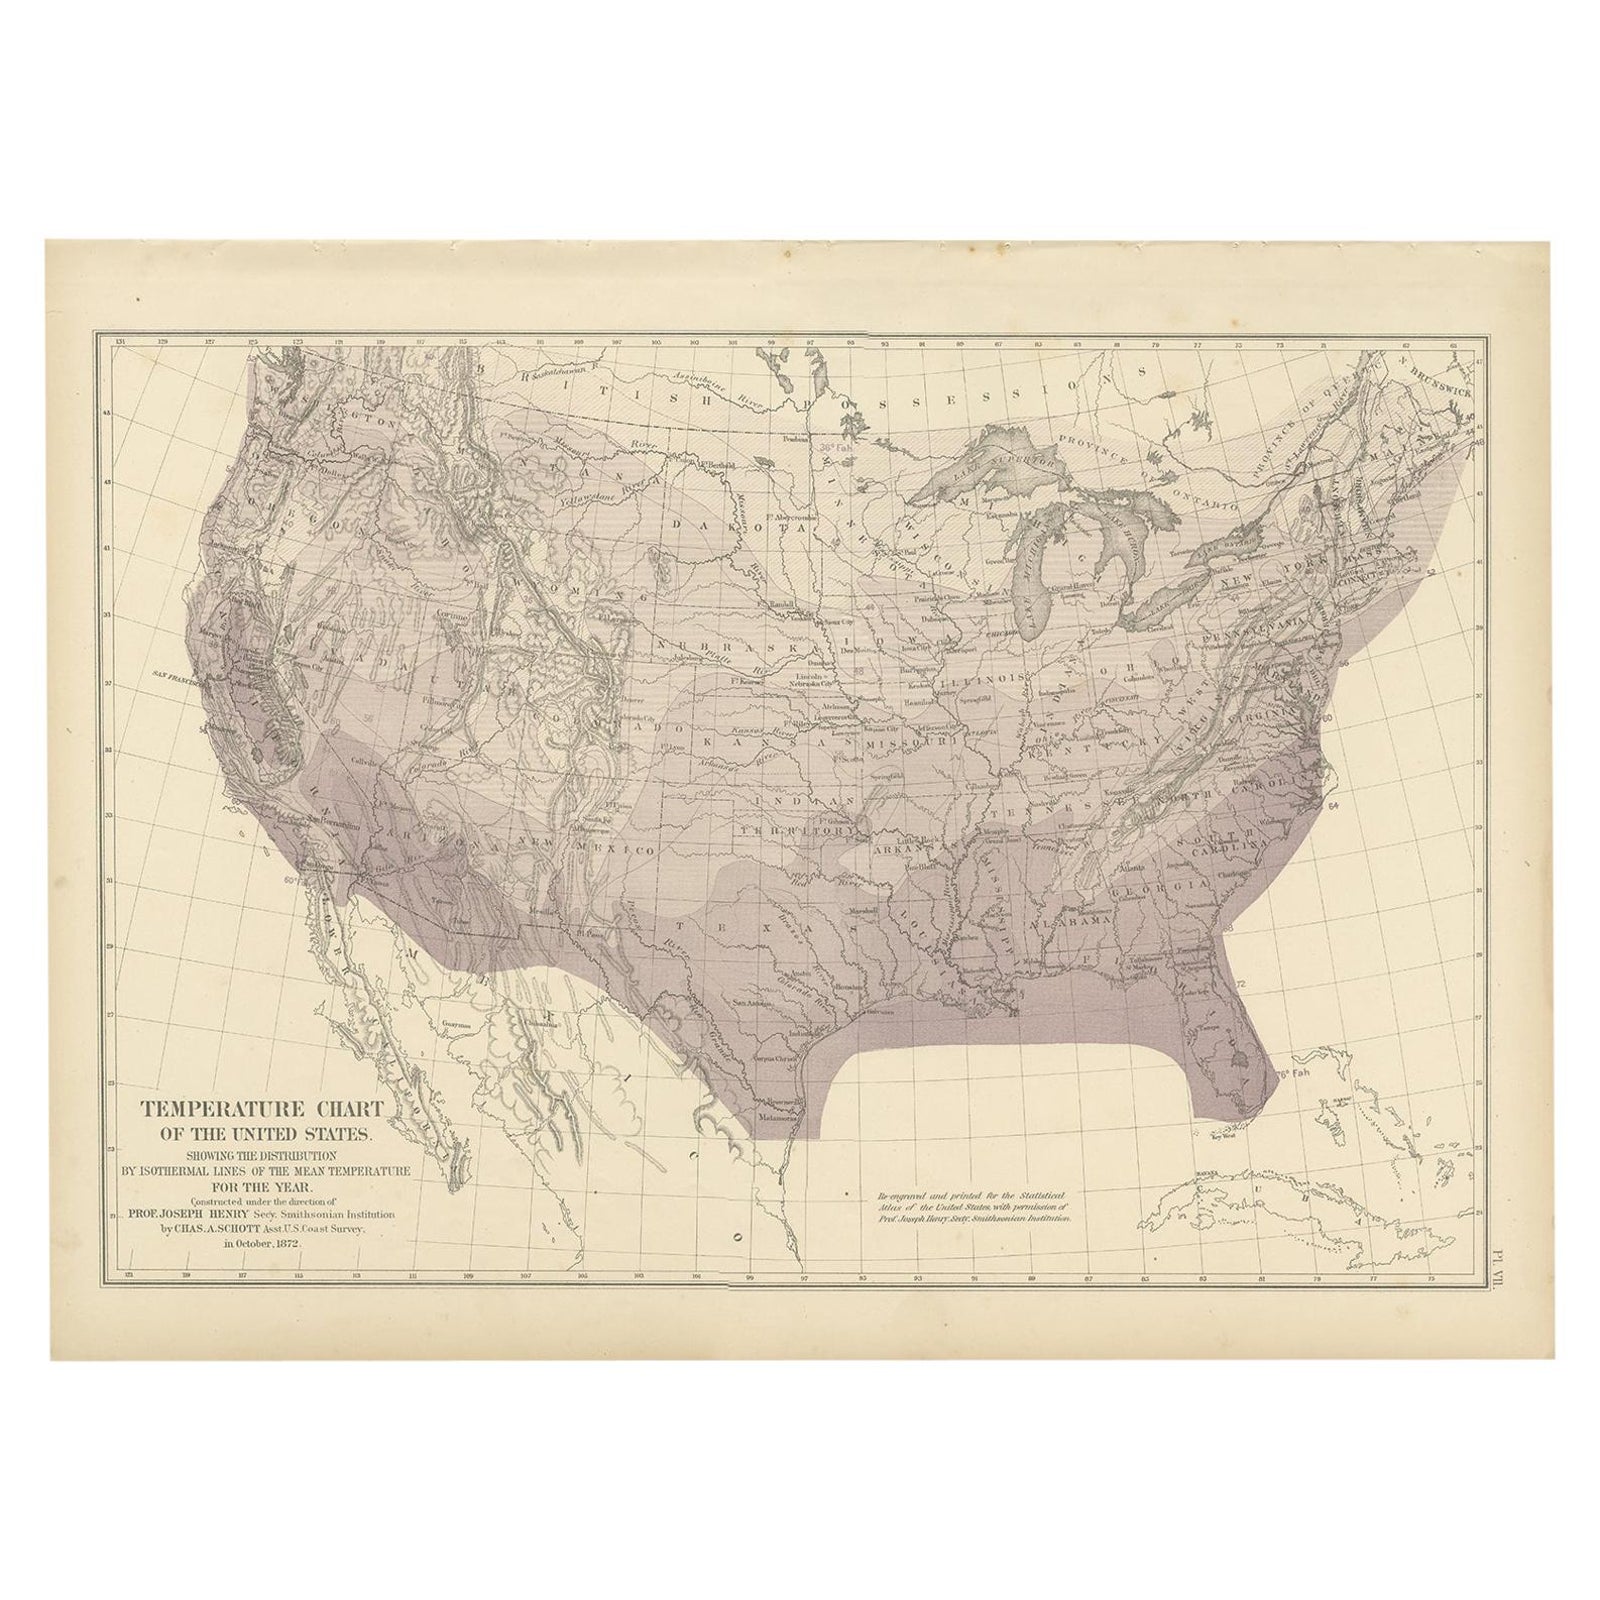
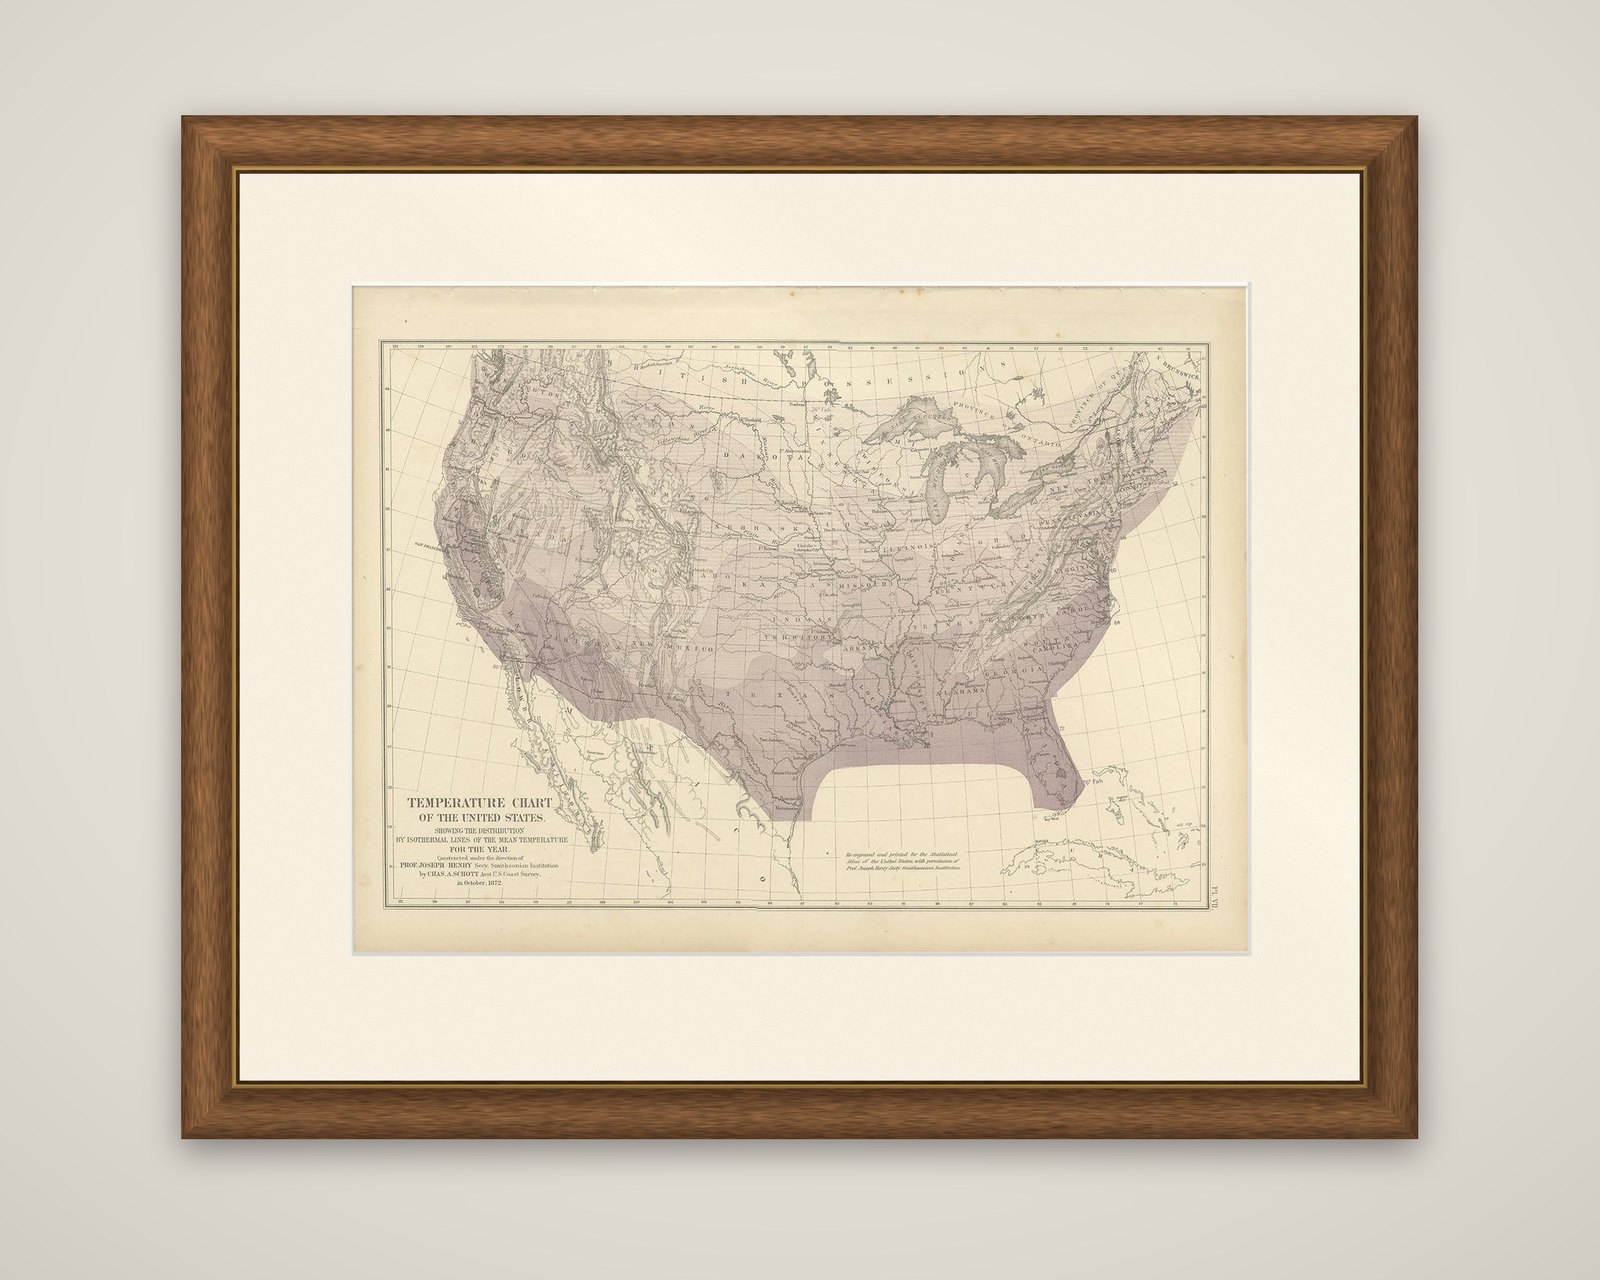
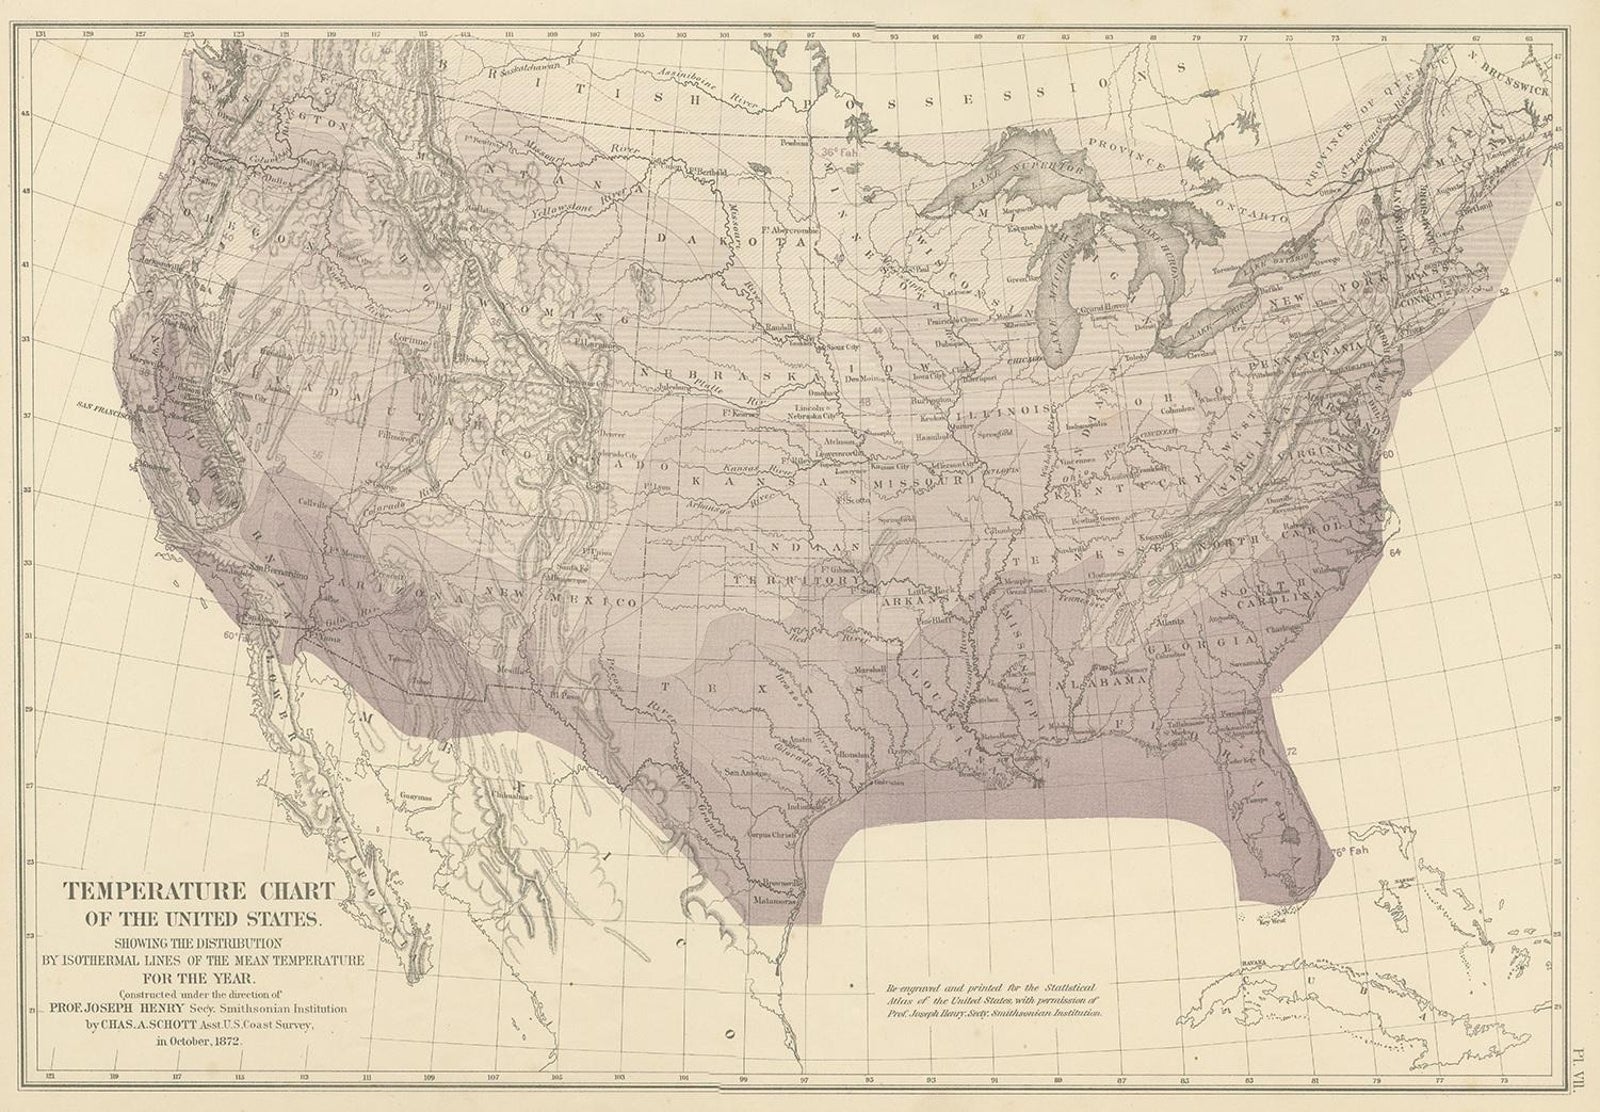
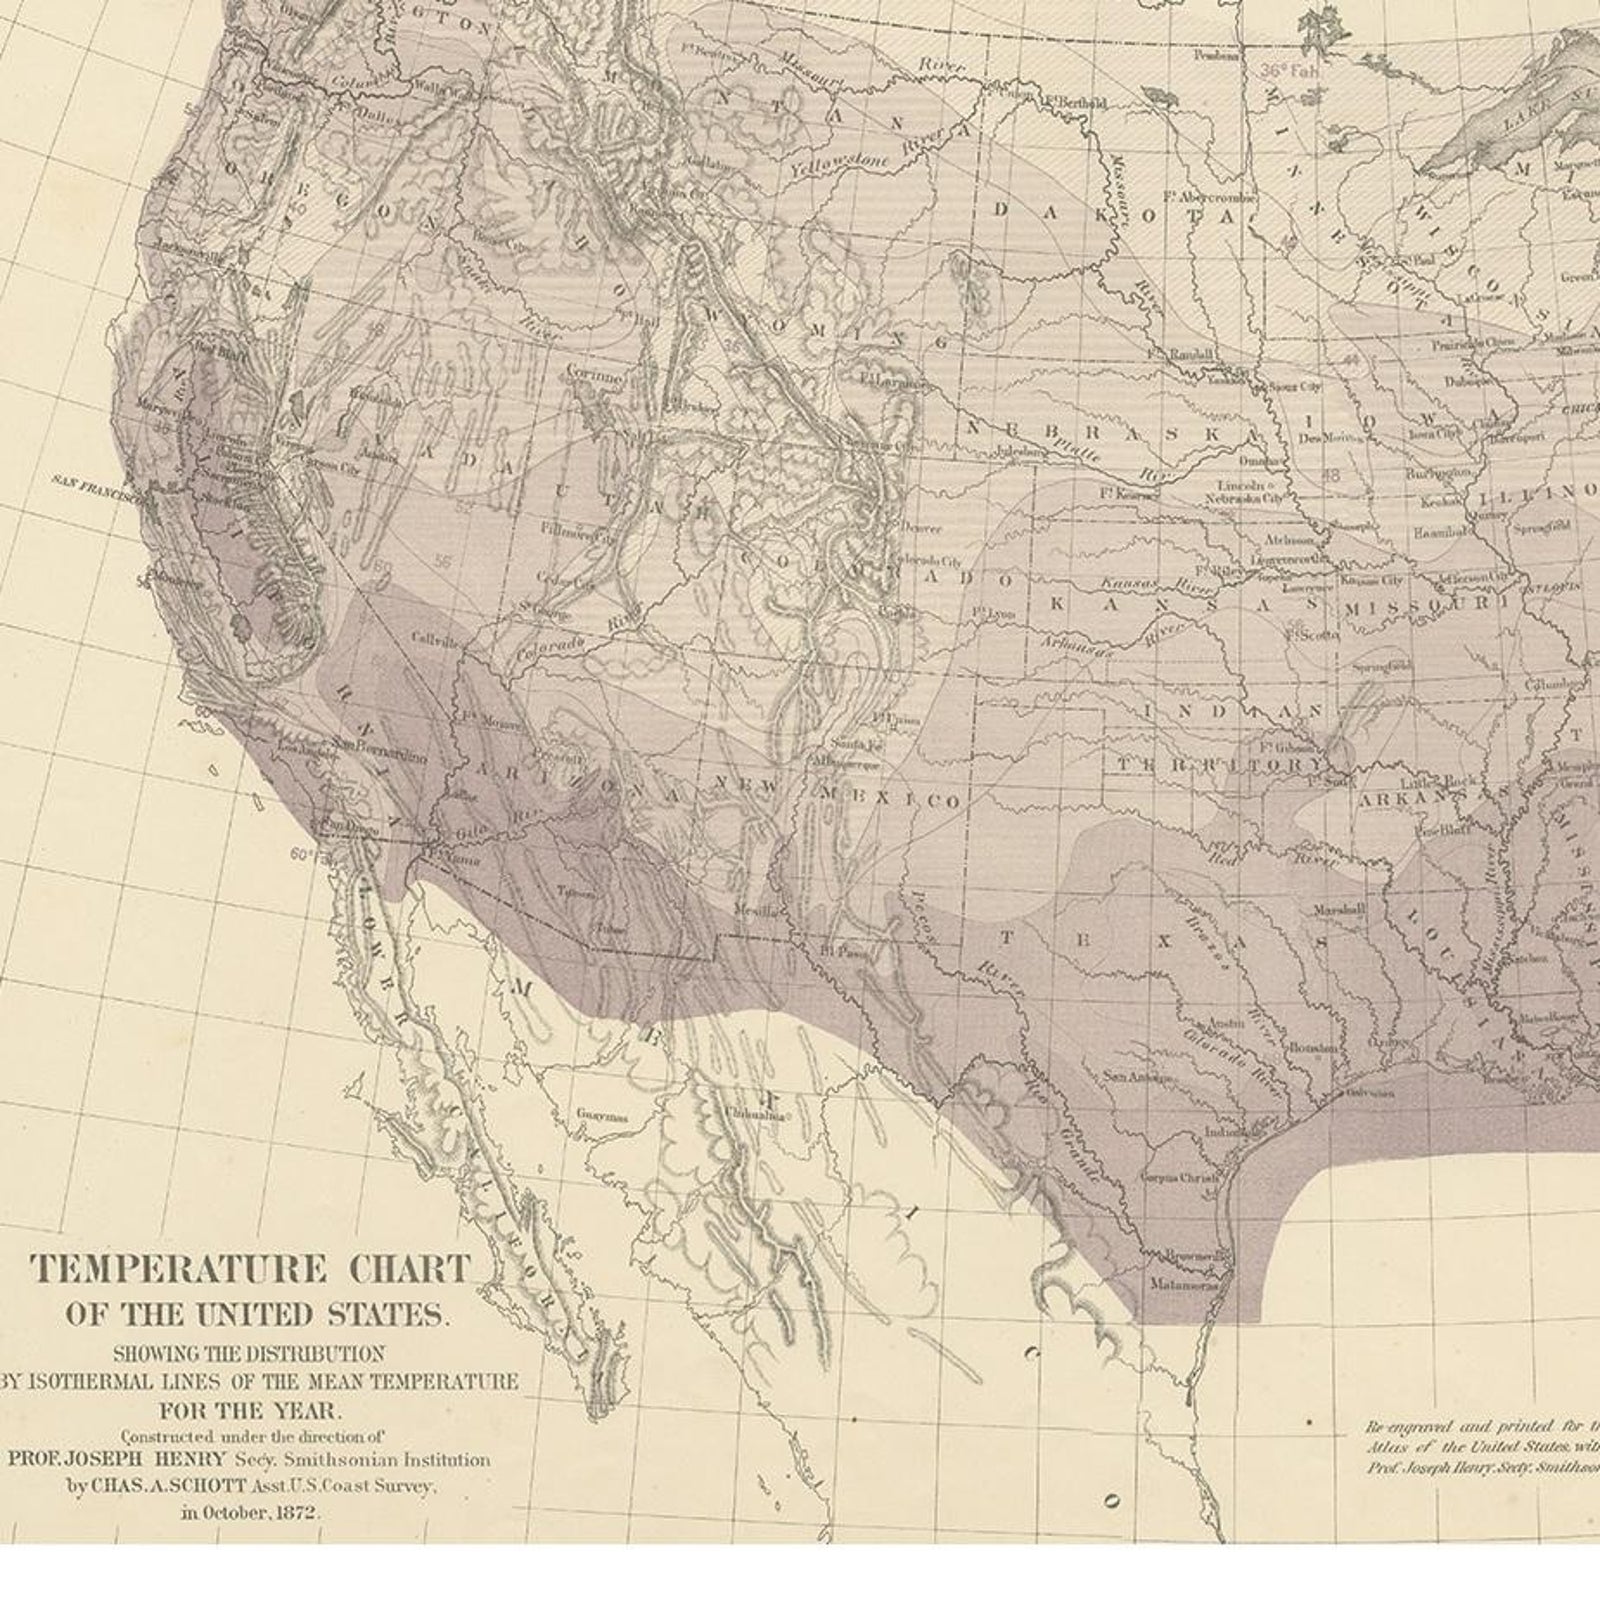
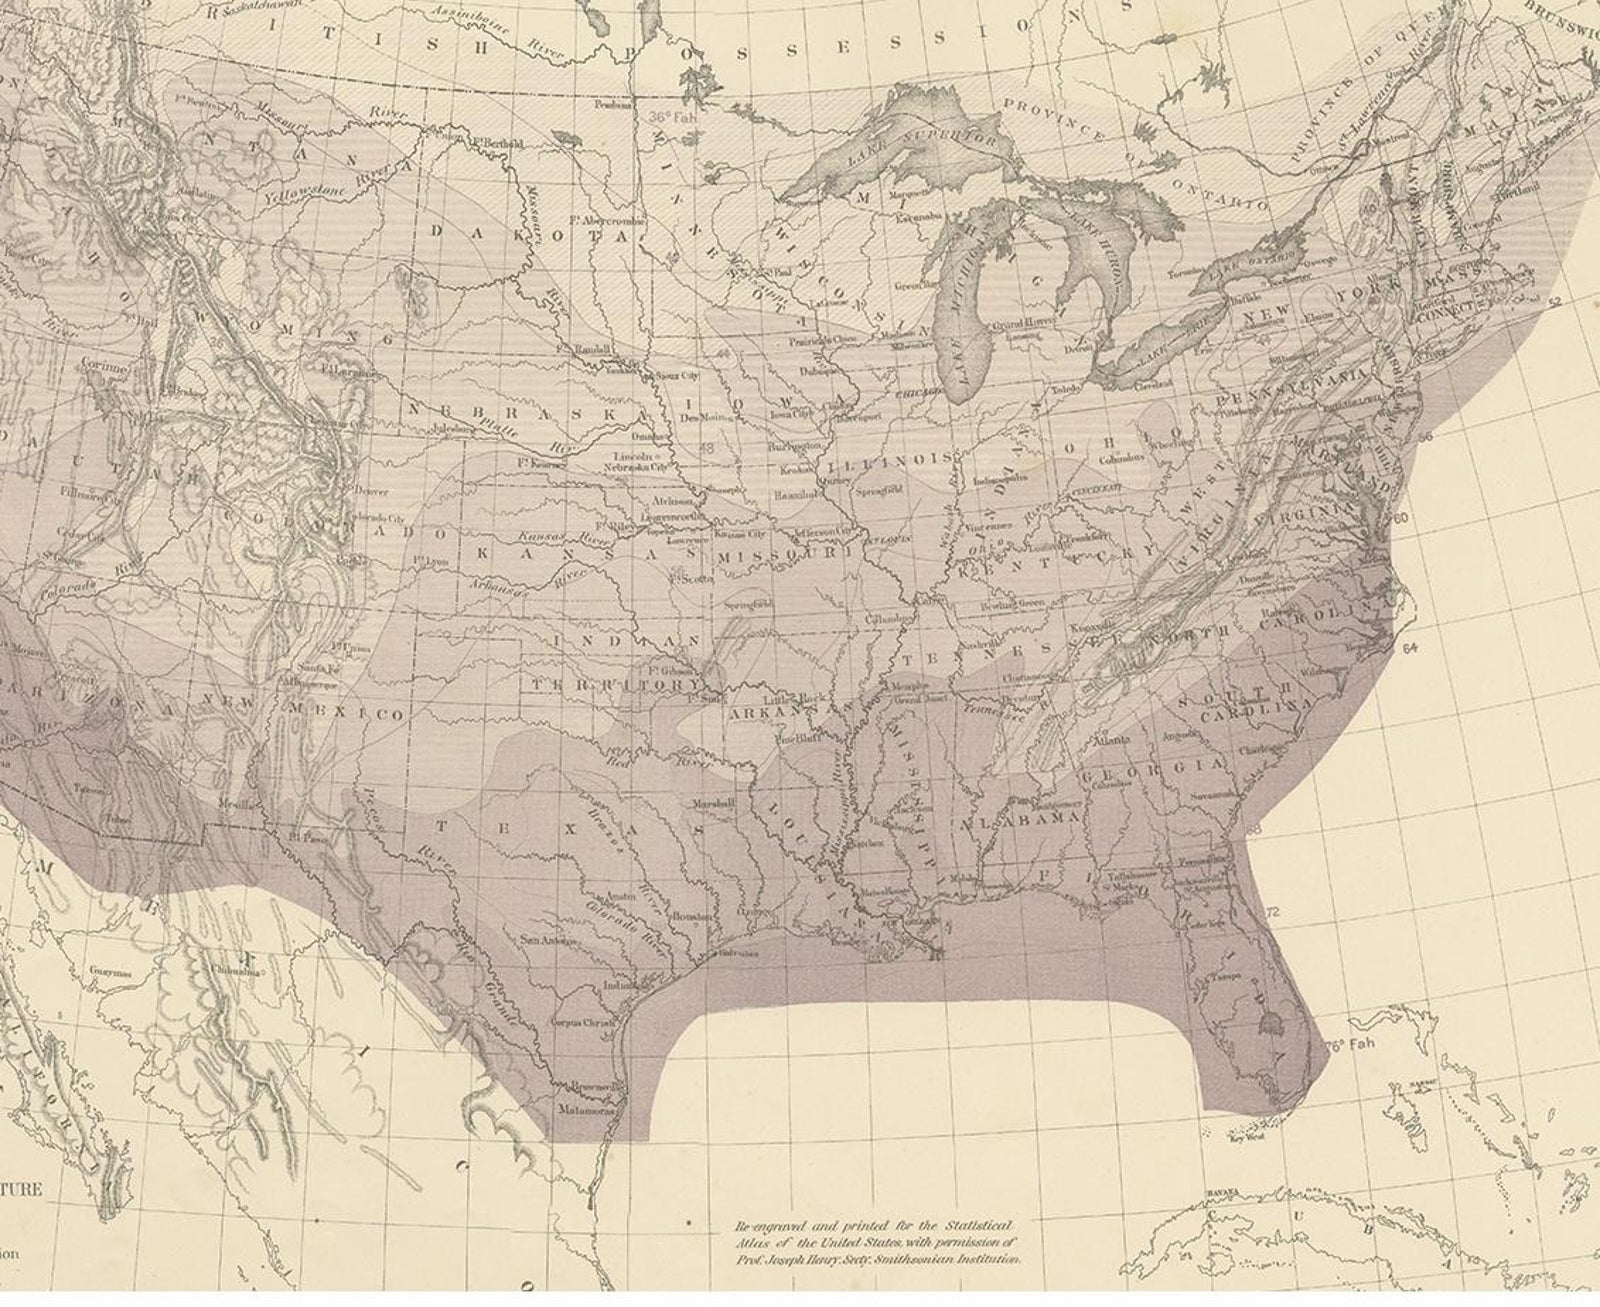
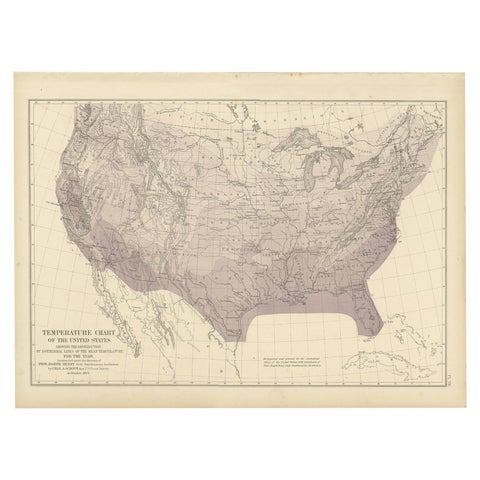
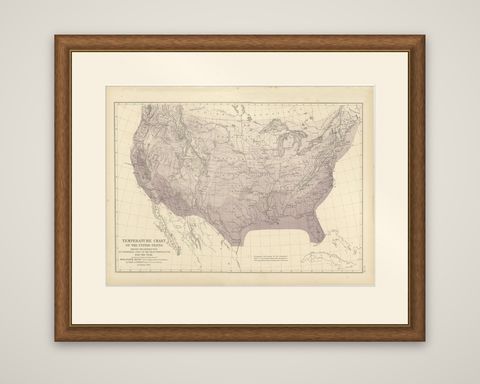
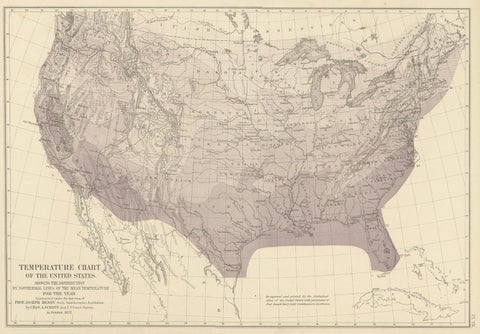
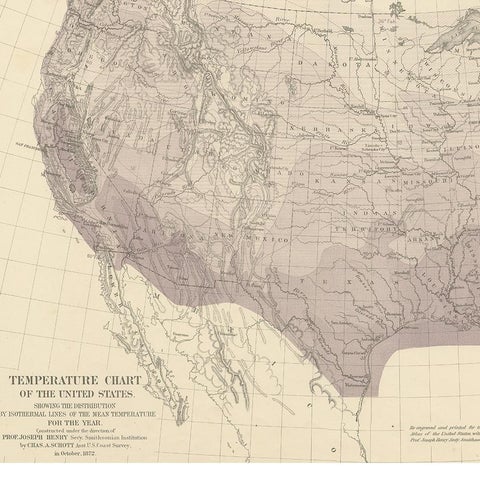
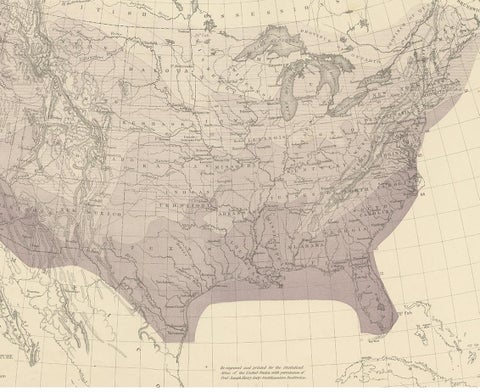
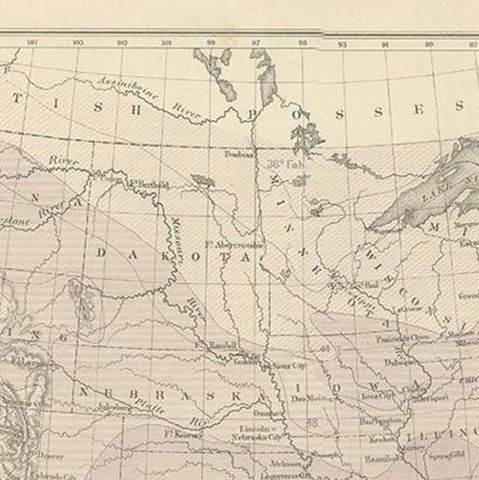
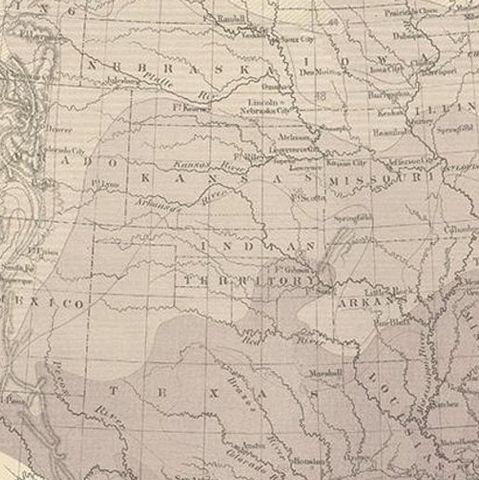
Pl. 7 Antique Temperature Chart of the United States by Walker, 1874
$560
€500 · dollar price at today's exchange rate
Shipping to the United States: $51 standard, $73 express, insured and tracked.
- Date
- 1874
- Kind
- Maps
- Size
- 41 × 55 cm (16.1 × 21.7 in)
- Condition
- Good. General age-related toning, minor wear. Blank verso, please study image carefully.
- Period
- The Gilded Age
- Reference
- BG-11875-7
What the condition grades mean
- Excellent
- Bright and clean, with no faults worth mentioning.
- Very good
- Only light signs of age, such as faint toning.
- Good
- Normal signs of age for a sheet of this period: toning, some foxing, small marks or neat old repairs.
- Fair
- Clear faults such as staining, tears or repairs, priced to match.
Every fault we see is written in the condition note, and the whole sheet is shown uncropped in the photos.
Guaranteed original. This is an original of the period stated, not a later reproduction or print-on-demand copy. If it is ever shown to be otherwise, we refund you in full.
Shipping to the United States. Sent from our gallery in Langweer, the Netherlands, flat between boards or rolled in a tube, and fully insured. Delivery and import charges.